A client report in 3 minutes instead of 4 hours
Raportly pulls data from Facebook, Instagram, Meta Ads and GA4, puts it into a PDF with your agency's logo and sends it to your client. Every month or every week, with no work from you. Between reports, the same numbers are on the dashboard.
No card needed. You get one client and their report for last month.
Reads data from:
TikTok and Google Ads in the next stage
Four hours your client doesn't pay for
The data sits in four dashboards, and each one counts reach or conversions its own way. At the end of the month, someone at the agency puts it together by hand, one client at a time.
By hand, one client, one month
- Export sessions and conversions from GA425 min
- Export campaigns from Meta Ads Manager20 min
- Facebook and Instagram statistics25 min
- Combine in a spreadsheet and work out ROAS45 min
- Charts and slide formatting60 min
- Logo, descriptions, commentary on the results40 min
- Fixes after the sources disagree30 min
- Total4 h 05 min
With Raportly, the same report
- Connect the client's accounts, once at the start3 min
- Report generated on the third day of the month0 min
- Check, comment and send3 min
- Total, every month3 min
With ten clients, that is more than 40 hours a month. The figures are estimates. Put in your own minutes and compare.
Social and ads in one report
Each client's report covers what you run for that client. For one it is just Instagram, for another Instagram, Meta Ads and GA4 together.
Four sources, one document
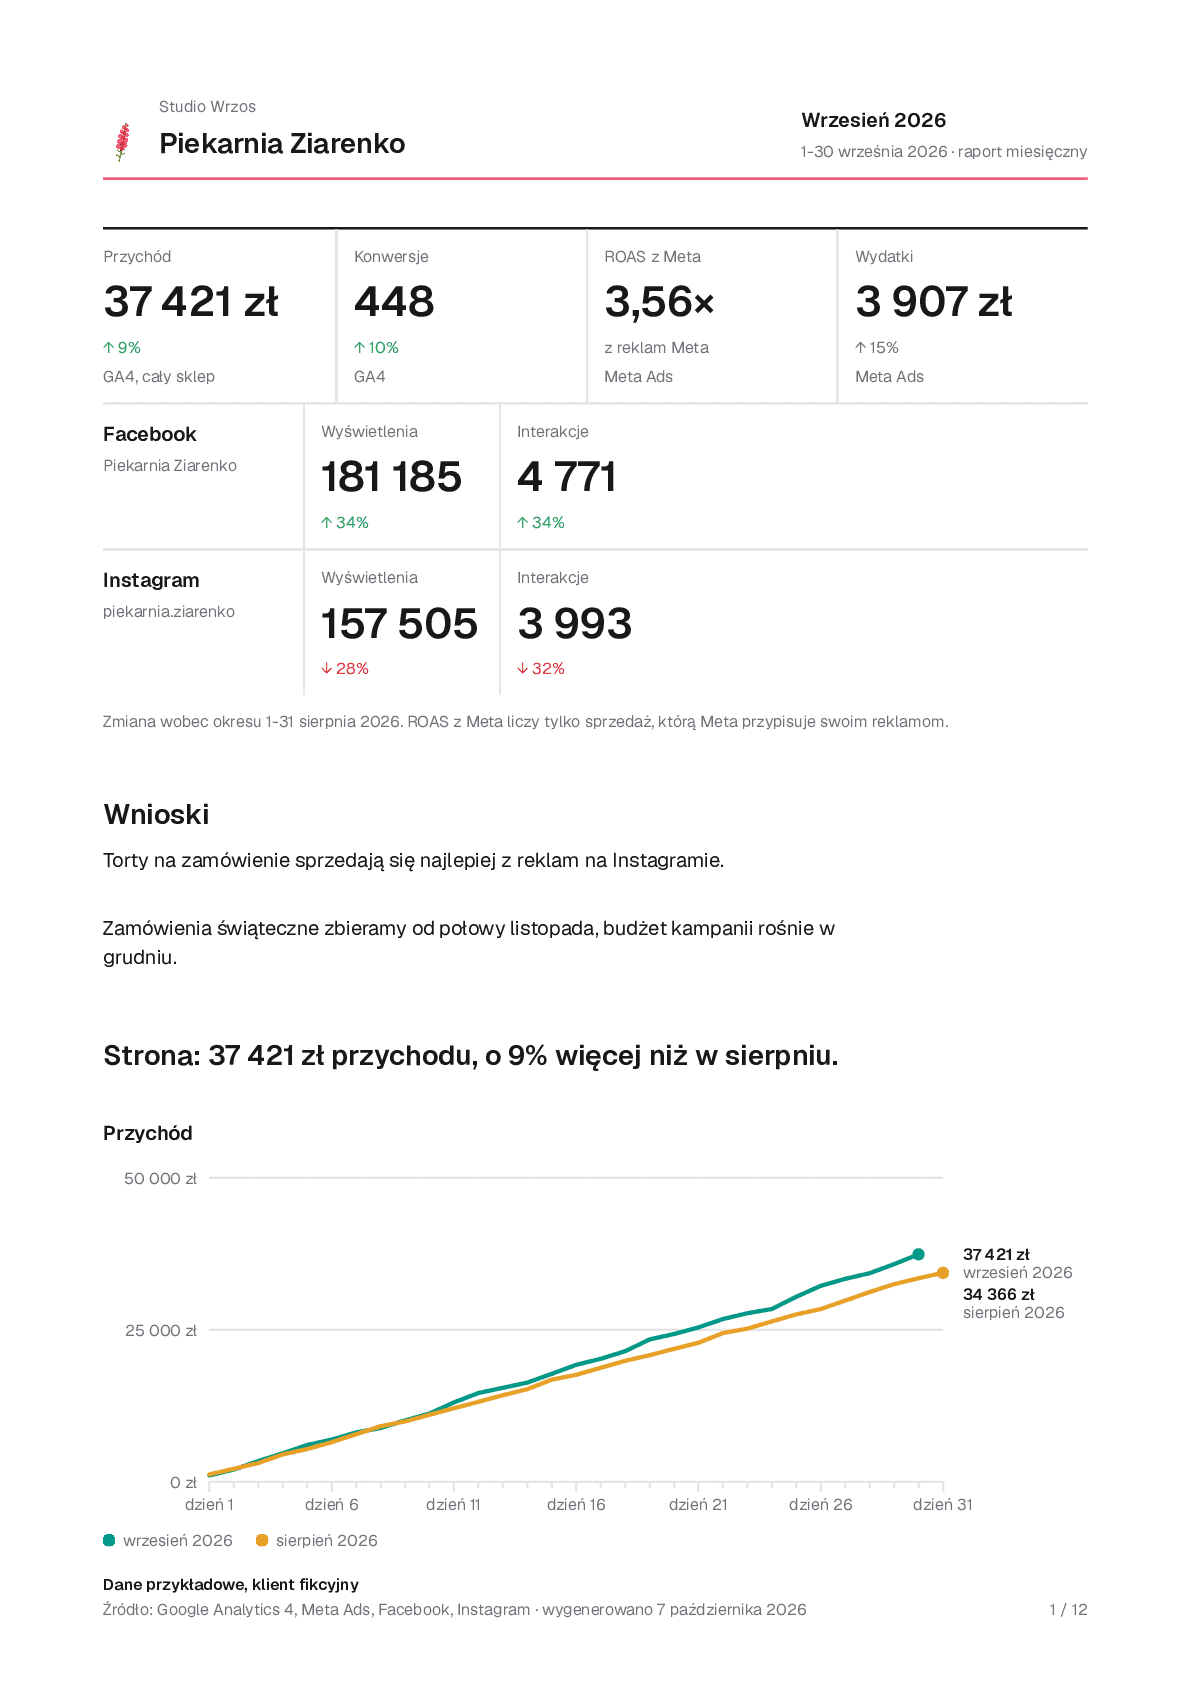
Facebook, Instagram, Meta Ads and GA4 in one PDF for the same period. You don't stitch exports together or send one client two separate files.
ROAS from both sources
Raportly works out ROAS from Meta Ads spend and GA4 revenue. You get one number instead of two dashboards that disagree.
Data in the European Union
We keep it in a database in the EU region. Access tokens for Google and Meta are encrypted and never reach the browser or the logs.
A report under your agency's brandGrowth and above
You set the logo, accent colour and section order once, and every report after that uses them.
It goes out without youGrowth and above
A monthly report goes to the recipients on the third day of the next month, a weekly one on the Wednesday after the week ends. Your client gets an e-mail from your agency with a link to the report.
Comparisons as standard
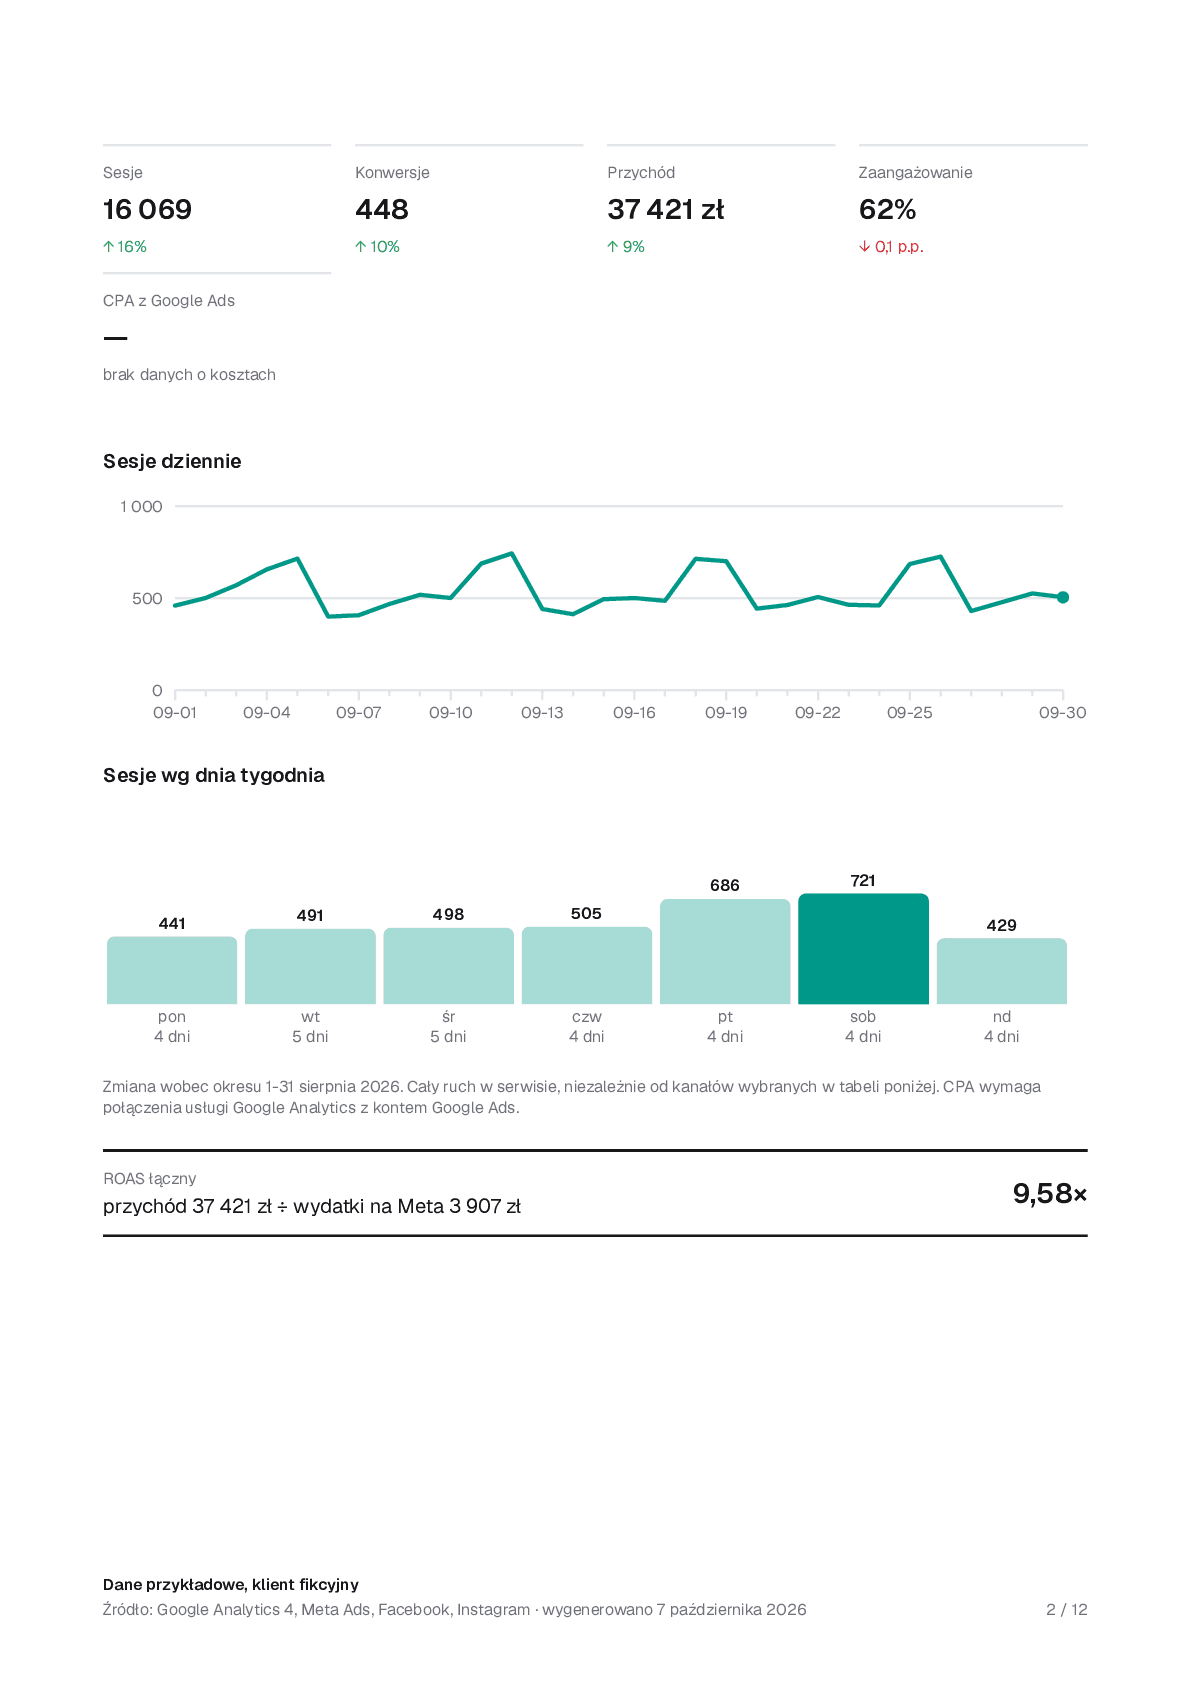
Every number in the report sits next to the one from the previous month or week. Your client sees straight away which way things are going.
Your client's results between reports too
Your client asks about a campaign mid-month, and the report goes out on the third. On the dashboard you can check their results at any time, in the same numbers that go into the PDF.
GA4 and Meta Ads on one screen
Sessions, conversions and revenue from GA4 next to spend, CPA and ROAS from Meta Ads. You see spend and results day by day, for the last 28 days or for a month or week you pick.
Budget to the end of the month
You see what the campaigns have spent since the start of the month and what they will spend by its end at the current pace. For an account with a spending limit, the dashboard also shows how much of it is left.
Campaign suggestions
When one campaign pays at least twice as much per result as another, the dashboard suggests how much budget to move. It also points out ads that Meta rates below average.
Facebook and Instagram, profile by profile
Each profile has its own view: followers, reach and the results of every post, with a preview of the top three. The "When to post" grid shows which days and times your client posted and the reach those posts got.
ComparisonsGrowth and above
You can put two profiles side by side for the same period, one profile against its previous period, or the profiles of two clients. Where Facebook and Instagram measure a number differently, we name Meta's metric.
Three steps to set up
- Step 1
You connect the accounts
You sign in with Google and Meta Business, once per client. Then you pick the profiles: the Facebook page, the Instagram account, the ad account, the GA4 property.
- Step 2
You set the schedule
You choose the profiles, the sections and the recipients on the client's side. On Growth and above, reports send themselves every week, every month or both.
- Step 3
Your client gets the report
An e-mail arrives from your agency with a link to the report. Your client enters their address, gets an access code and reads the report in the browser or downloads the PDF.
You pay per agency, not per client
Freelancer gives you every integration and a report you generate yourself. On Growth and above, Raportly sends the reports to your clients itself, under the agency's logo. You can end the subscription at any time.
Freelancer
For one person
- Up to 5 clients
- 5 profiles per client
- 1 user
- Facebook, Instagram, Meta Ads and GA4
- PDF report generated by hand
Growth
For growing agencies
- Up to 20 clients
- 10 profiles per client
- 3 users
- Everything in Freelancer
- Your own report layout and presets
- Profile comparisons
- Weekly and monthly reports sent automatically
- Agency logo and colours on the report
Agency
For agencies that scale
- Up to 50 clients
- Unlimited profiles
- Unlimited users
- Everything in Growth
- Report on your own domainsoon
- API accesssoon
AgencyAnalytics charges 20 to 25 dollars a month for each client you manage. With twenty clients, that comes to about PLN 1,600. The Growth plan costs PLN 699 and covers the same number of clients, social media included.
Common questions
How does the free report work?
You create an account without a card, connect one client's accounts and download their report for the last closed month. That is one report on the Starter plan. After that, you can choose a paid plan. If you don't, your data stays available to view for 90 days, and then we delete it together with the account.
What works today?
Facebook, Instagram, Meta Ads and GA4 in one PDF report and on each client's dashboard. You download the report yourself for any closed month or week, and on Growth and above it sends itself. TikTok and Google Ads come in the next stage.
We only run social media, no ads.
Freelancer includes every integration at one price, so you connect just Facebook and Instagram and pay nothing extra. When campaigns come along, you add the ad account and GA4 without changing plans.
What about the agency's data and its clients' data?
The database runs in the European Union region. Access tokens for Google and Meta are encrypted and never reach the browser or the logs. Deleting your account erases the data.
Can the report match the agency's brand?
On Growth and above, you set the logo, accent colour and section order, turn off the sections your client doesn't read, and add a comment above each one.
The agency uses Looker Studio. What changes?
Looker Studio is free and flexible, but it needs setting up and maintaining every time Google or Meta changes an API. Raportly takes that cost away: on the third day of the month, the report is in your client's inbox with no work from your team.
Your first report is free
Create an account, connect one client's accounts and download their report for last month. It will show you whether Raportly counts the way you do.
No card needed. You choose a paid plan only after you download the report.