Your client's Facebook and Instagram, profile by profile
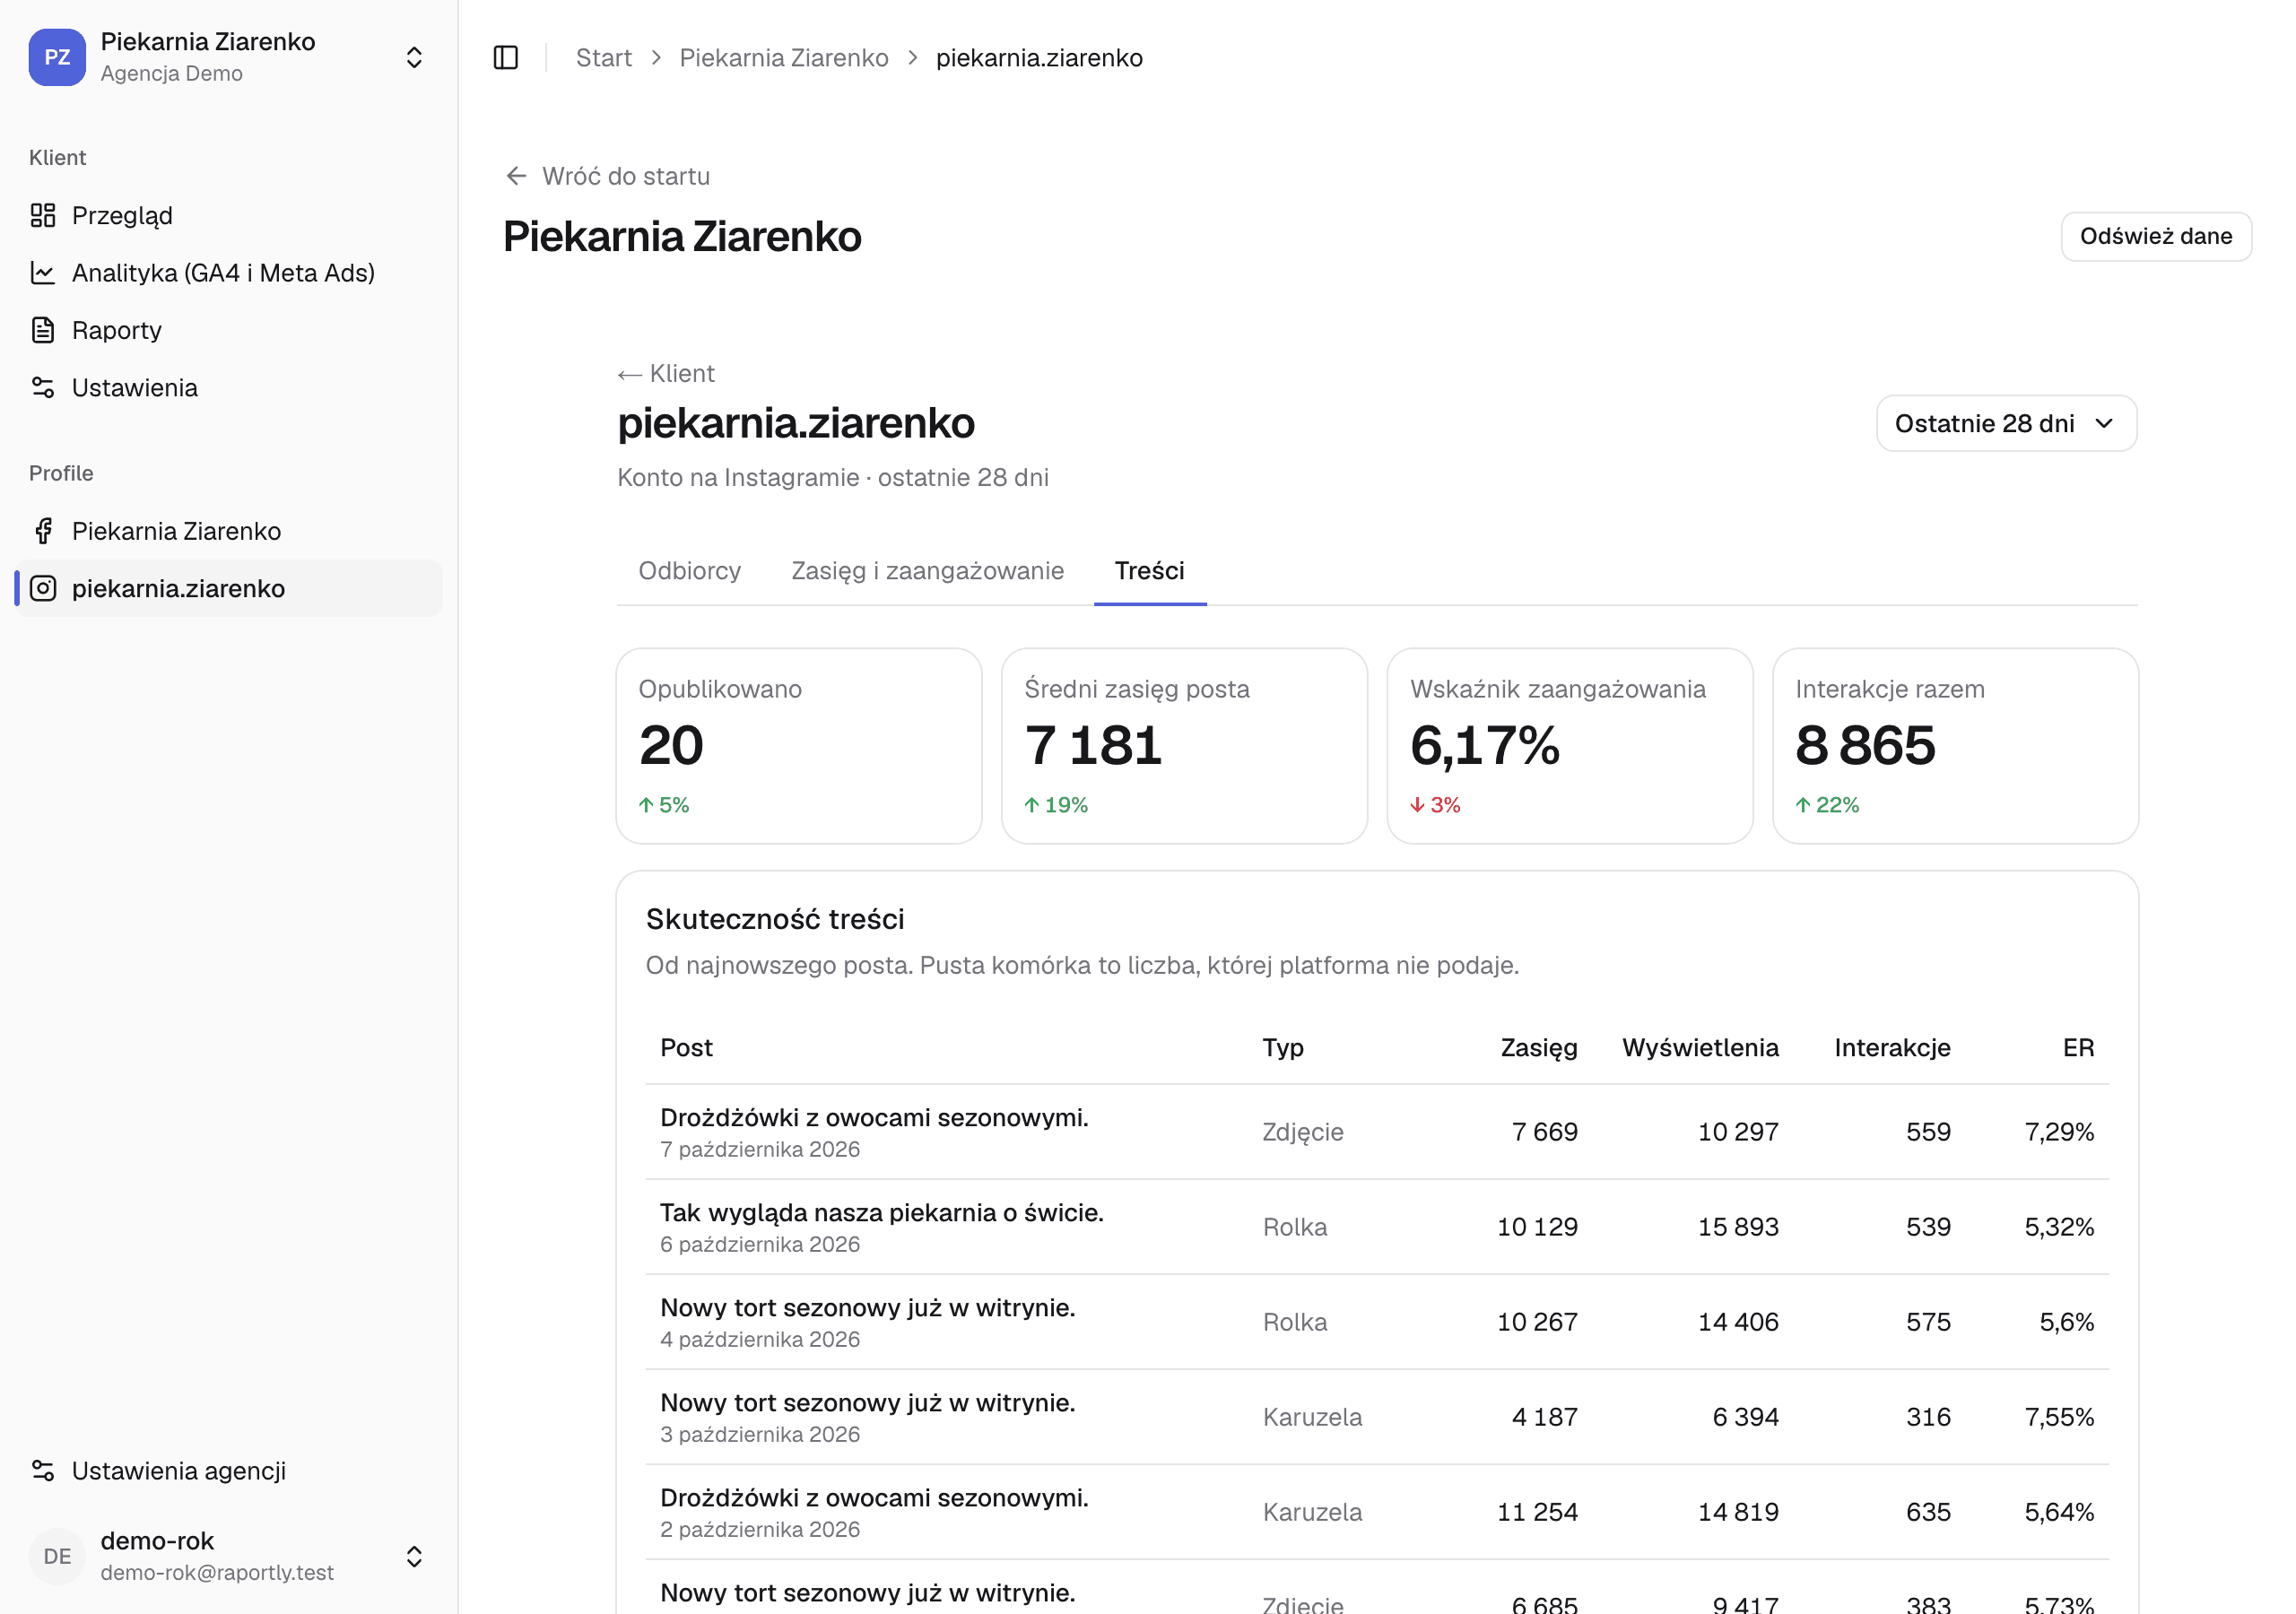
Every Facebook page and every Instagram account has its own view with three tabs: audience, reach and engagement, and content. The same figures go into the report.
Audience
Followers, their daily growth and their countries. On Facebook you see new followers and unfollows separately, and from 100 followers Instagram also gives age and gender.
Reach and engagement
Reach and views day by day, interactions by kind, frequency and engagement rate. Reach counts unique accounts, views count every view.
Content
Every post with its reach, views, interactions and ER. We compare post types by average reach, videos and reels have their watch time, and the three best posts come with a preview.
When to post
A grid of weekdays and times of day shows how many posts the client published in each slot and their average reach. You set the date range with the From and To fields.
Your first report is free
Create an account, connect one client's accounts and download their report for last month. It will show you whether Raportly counts the way you do.
No card needed. You choose a paid plan only after you download the report.