Your client's GA4 and Meta Ads on one screen
The dashboard shows the same figures that go into the report, for the last 28 days or for a month or week you choose. You can check them at any time, mid-month included.
Every source in one overview
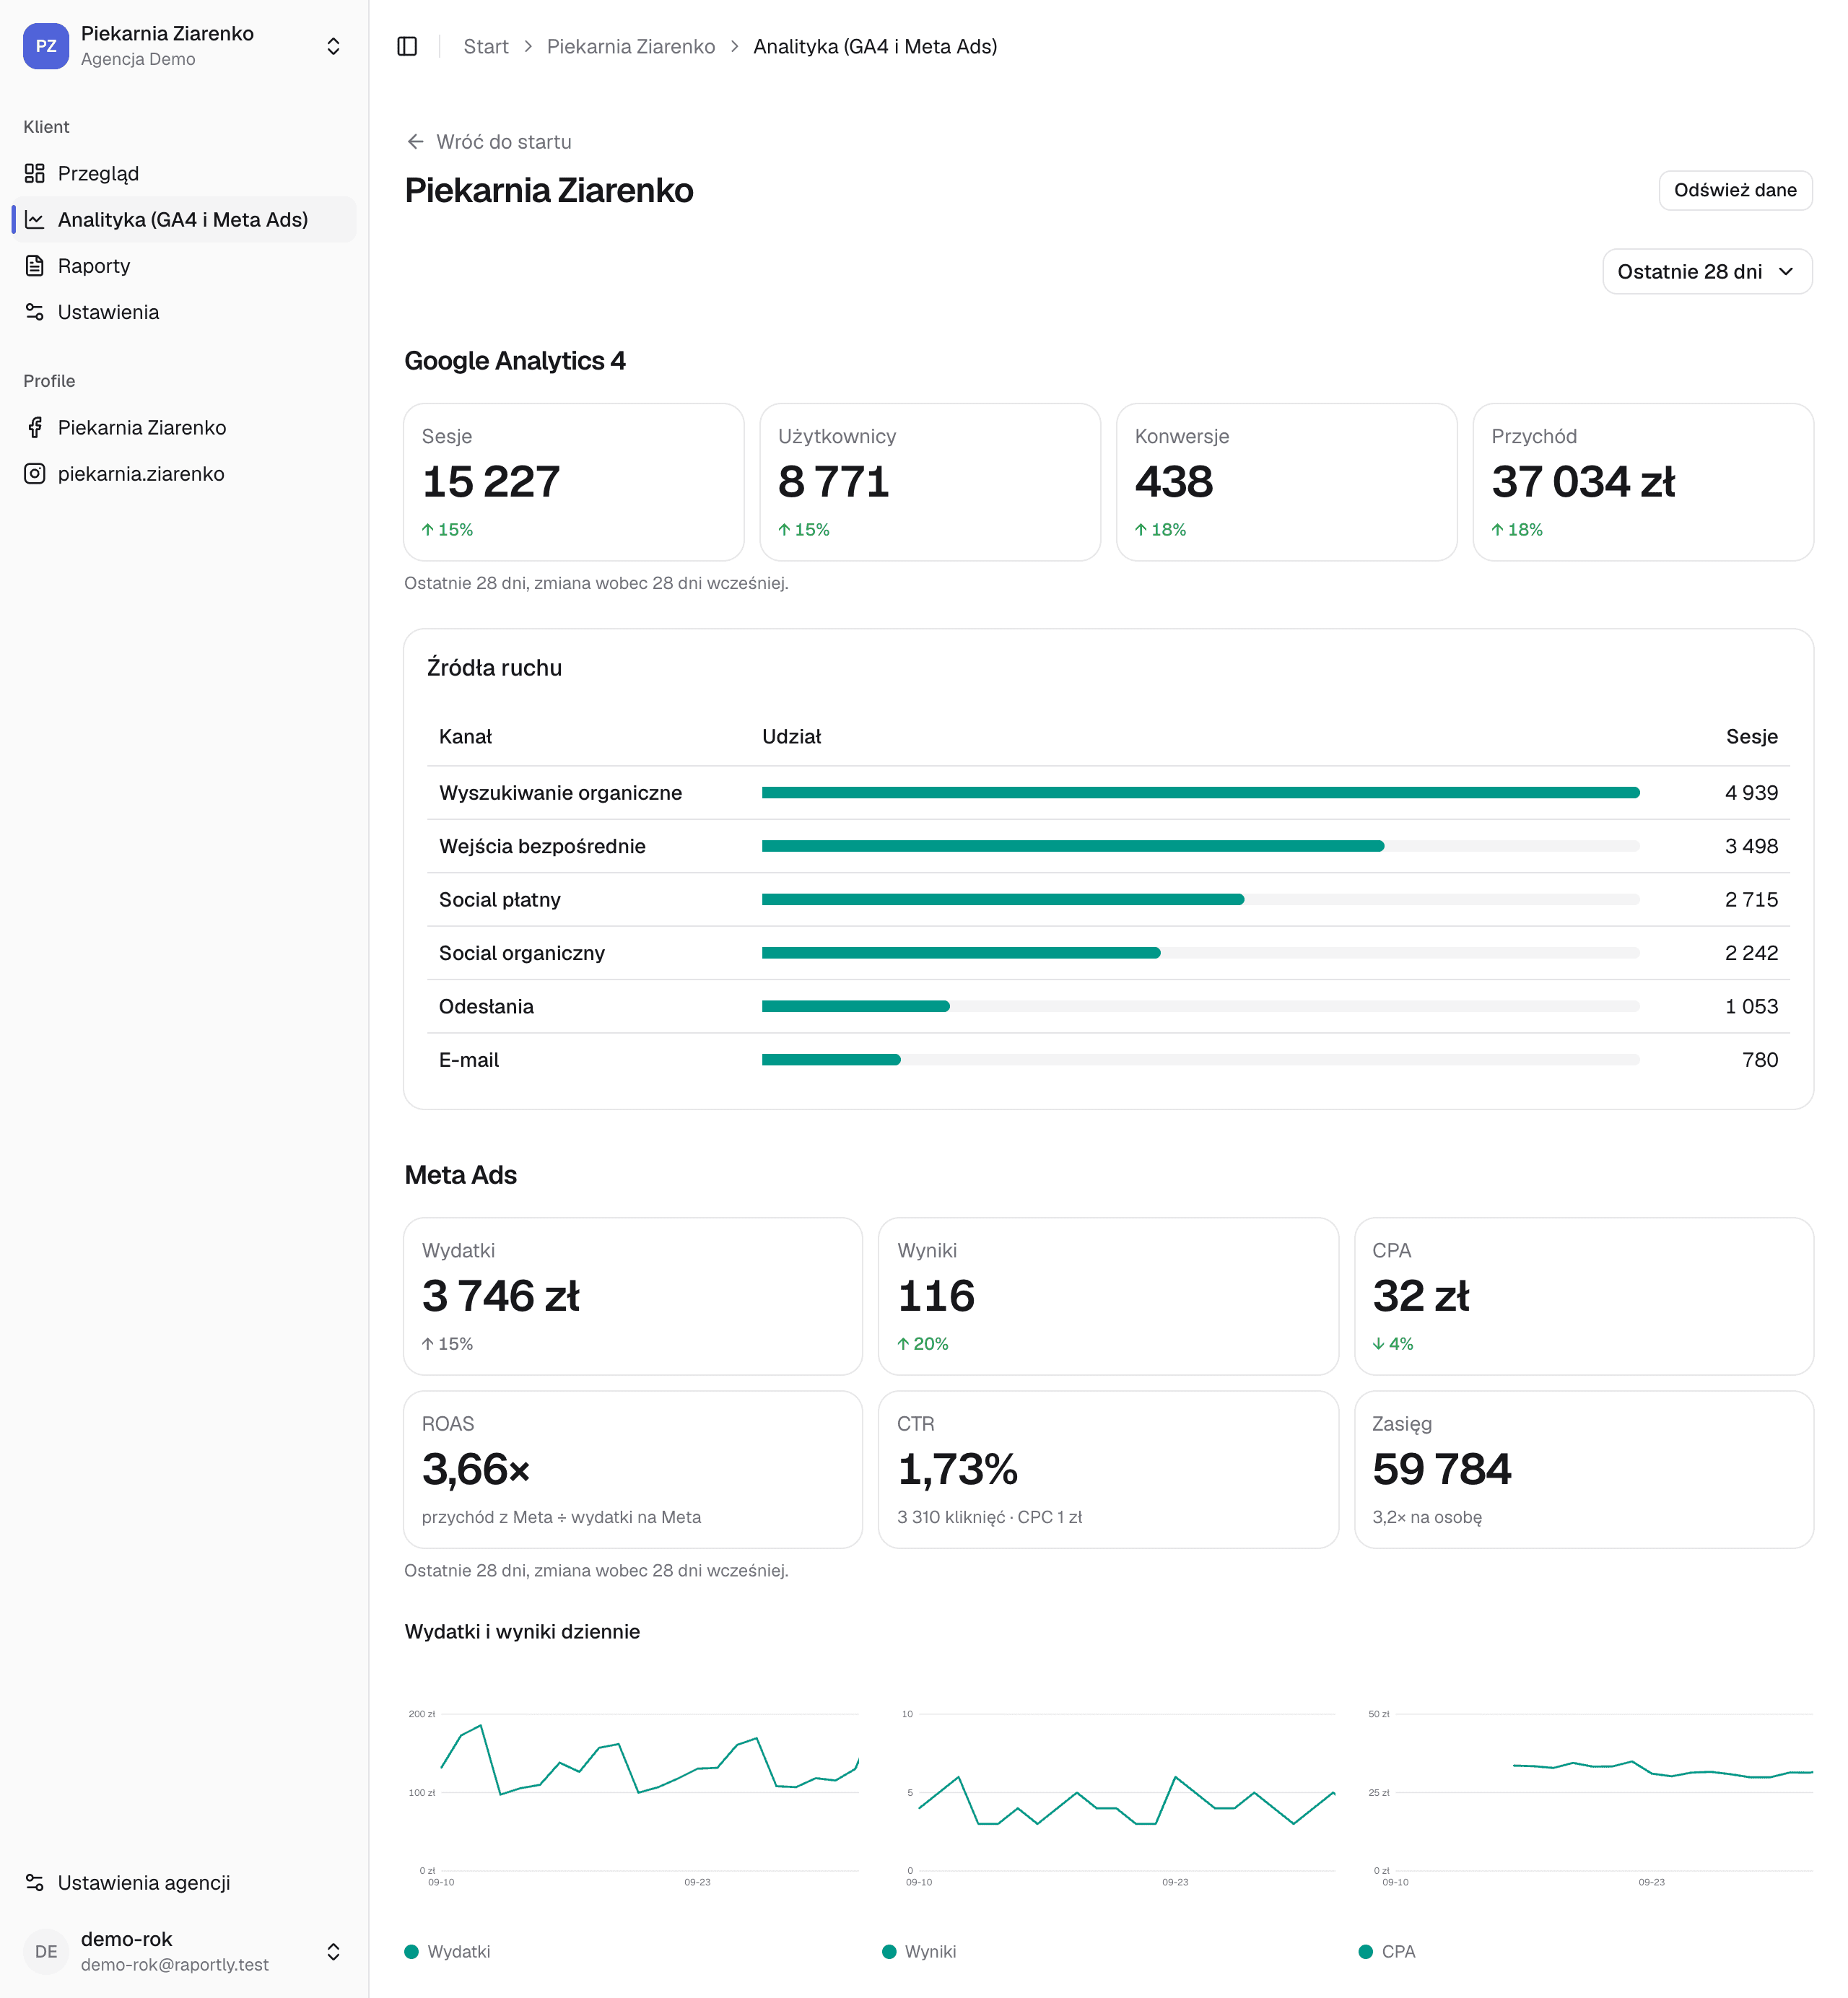
Each connected source has its own card: followers and reach from Facebook and Instagram, spend and CPA from Meta Ads, sessions and revenue from GA4.
Traffic, spend and ROAS day by day
GA4 traffic channels with their share of sessions, next to the campaigns' ROAS, CTR and reach. Spend, results and cost per result each get their own chart, so the smaller figure isn't flattened by the larger one.
The budget to the end of the month
You see how much the campaigns have spent since the start of the month and how much they will spend by its end at the current pace. For an account with a spending limit, the dashboard also shows how much of it is left.
Campaign suggestions
When one campaign pays at least twice as much per result as another, the dashboard suggests how much budget to move. It also points out ads Meta rates below average, and the day the budget runs out at the current pace.
Refresh on demand
We fetch the data every night. When you need it now, the “Refresh data” button fetches it profile by profile.
Your first report is free
Create an account, connect one client's accounts and download their report for last month. It will show you whether Raportly counts the way you do.
No card needed. You choose a paid plan only after you download the report.