Two profiles, two periods or two clients side by side
A comparison answers the questions that come up in a client meeting: is Instagram doing better than Facebook, and was this month better than the last one.
Two profiles for the same period
A Facebook page next to an Instagram account, or two accounts on the same platform, for the last 28 days or for a month or week you choose.
A profile against the previous period
Two columns and the difference in percent, and for the engagement rate in percentage points. The arrow shows the direction of the change, the colour tells you whether it is good news.
Two of your agency's clients
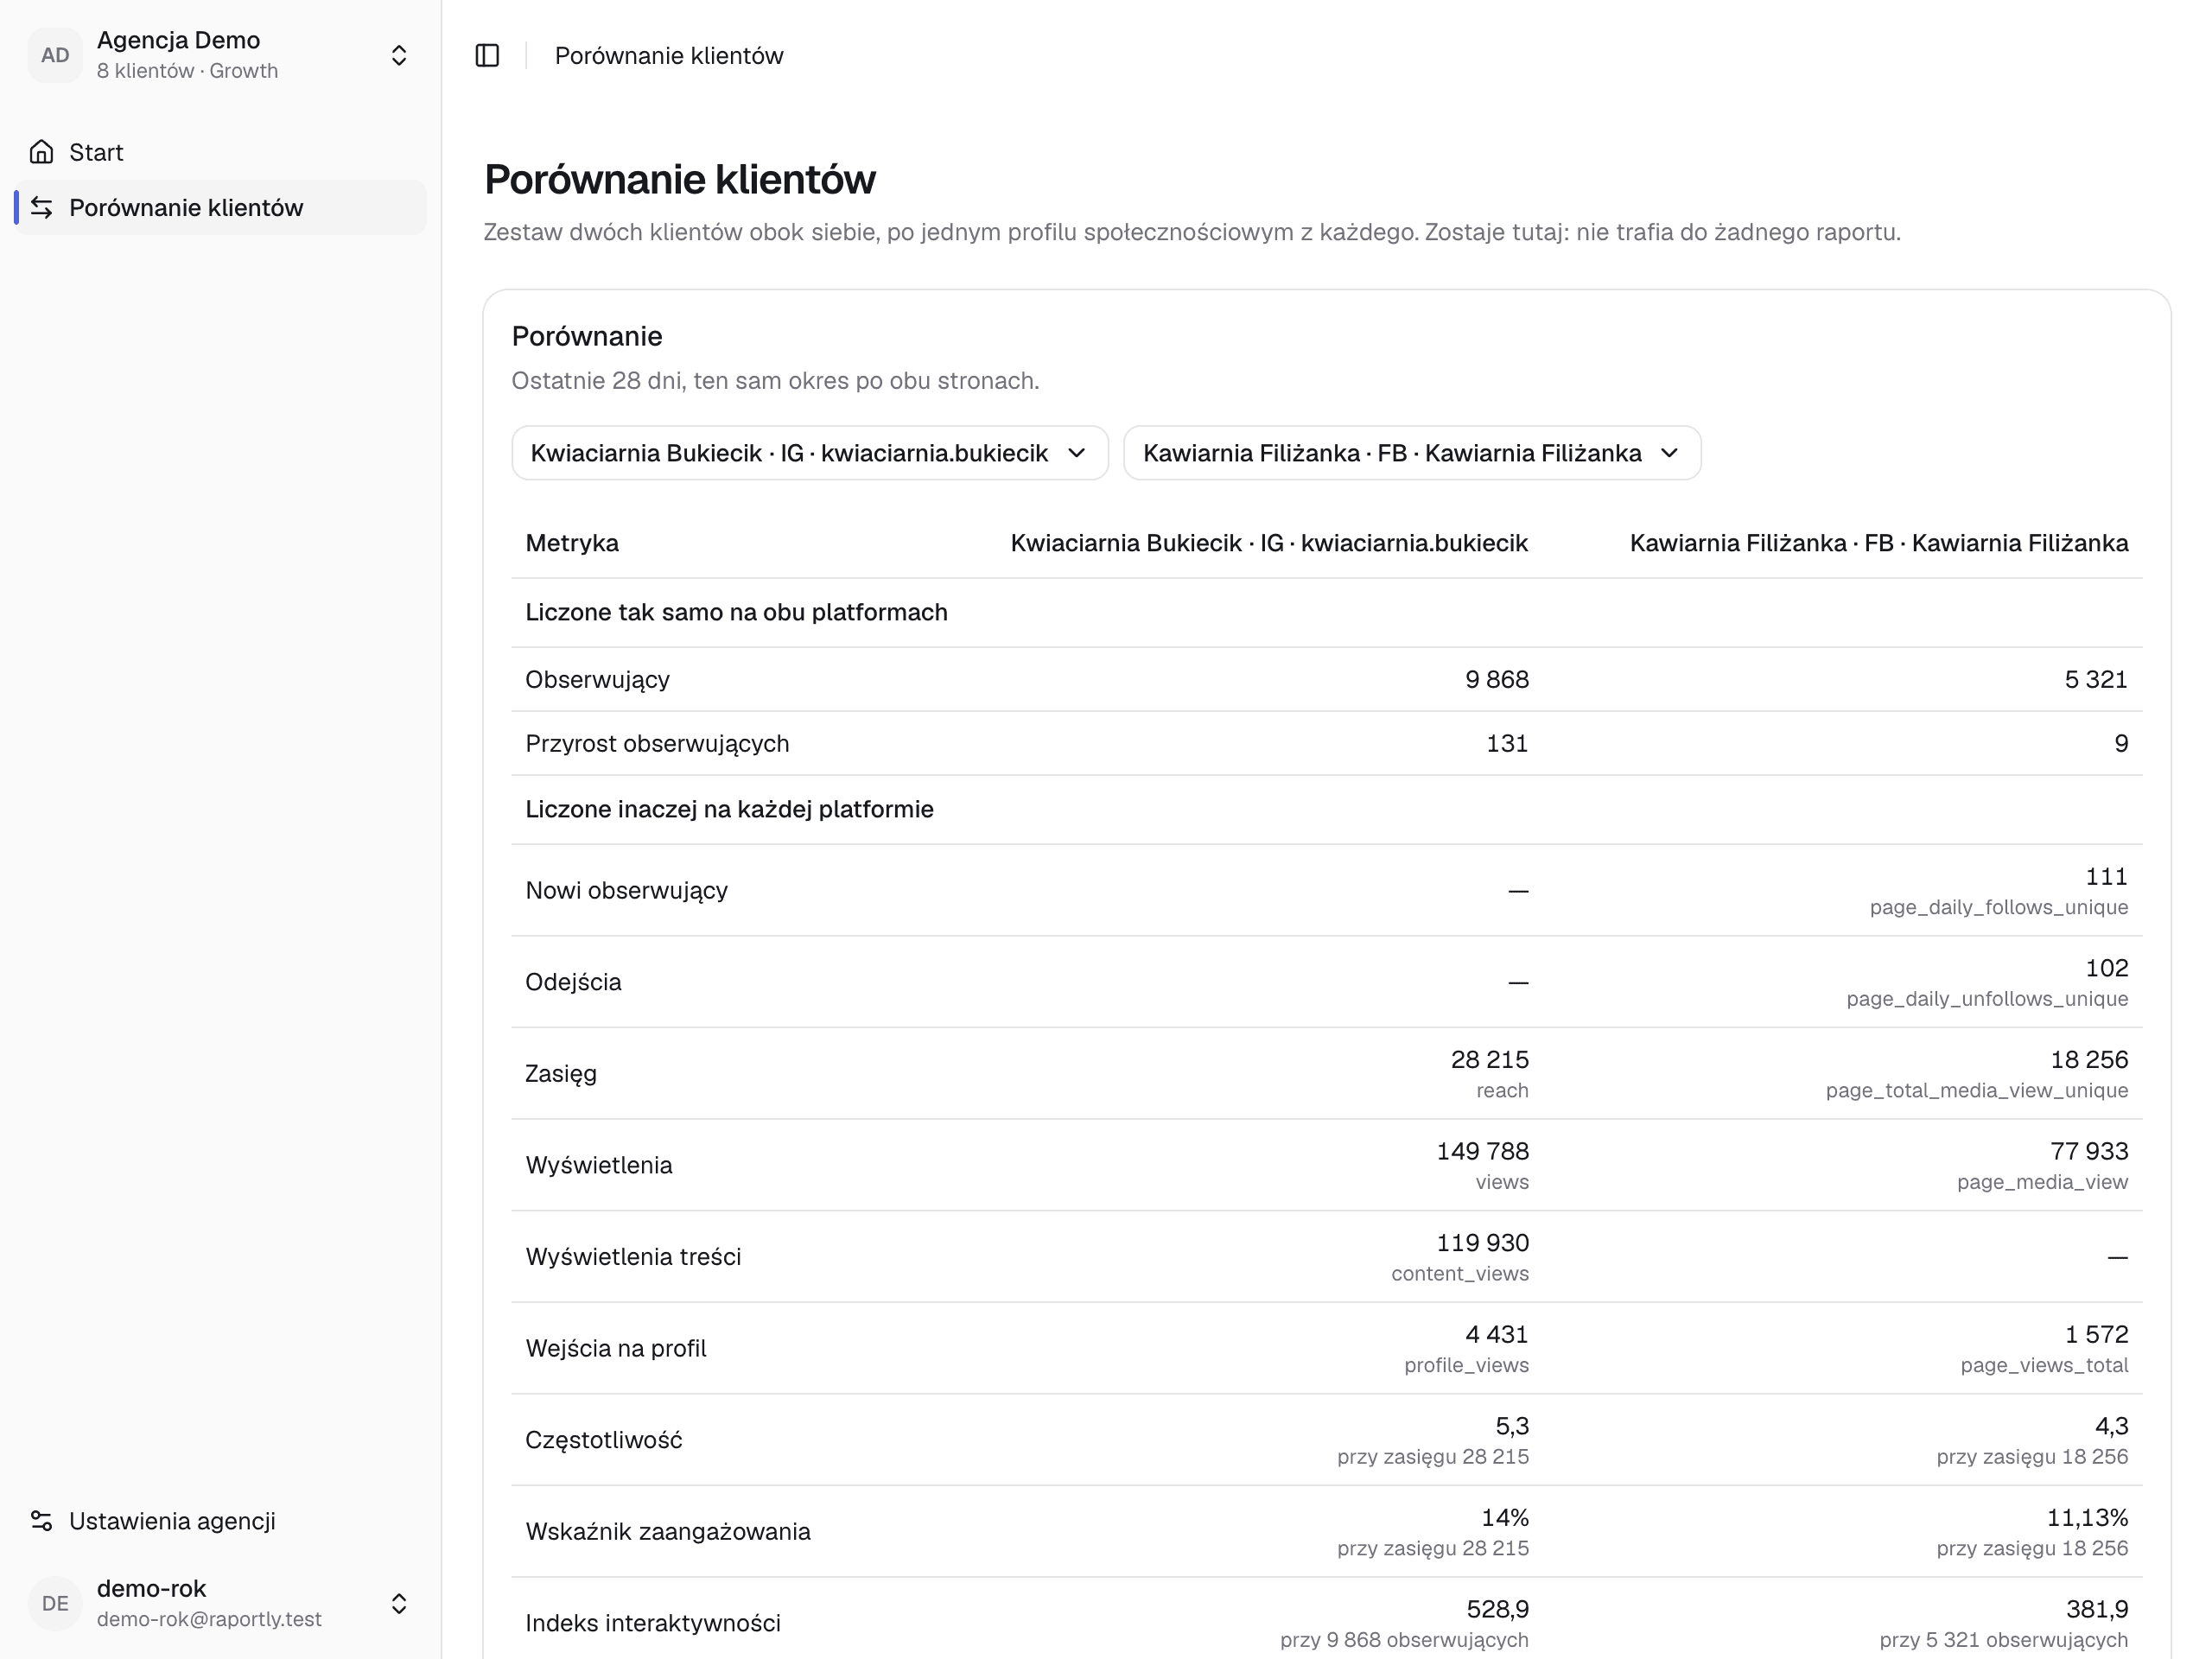
A separate screen sets the profiles of two different clients side by side for the same 28 days. It stays in the app and goes into no report.
Differences between platforms
Facebook and Instagram measure some figures differently. Those rows sit in a group of their own with Meta's name for the measurement under the figure, and next to the rates we say which reach they are calculated from.
Your first report is free
Create an account, connect one client's accounts and download their report for last month. It will show you whether Raportly counts the way you do.
No card needed. You choose a paid plan only after you download the report.